STE
Temperature sensor, no probe
Internal sensing element.
Faixa de mediçãoTemperature from -40 to +122°F (-40 to +50°C)
Aplicação típicaCold rooms, technical rooms and medication fridges.
The sensor measures at the equipment, the gateway aggregates and sends, the cloud analyzes and the right team is alerted on the right channel.
temperature, humidity, pressure, water and more.
local buffer that survives network outages.
end-to-end encrypted data.
real-time detection and prediction.
WhatsApp, SMS, email or voice, with a suggested action.
Wireless device that measures continuously, stores data locally and transmits it over LoRa to the Data Gateway. Powered by two AA batteries, it runs for 1 to 5 years without maintenance, depending on the transmission interval. Plug and play installation, with setup done through the app over Bluetooth.
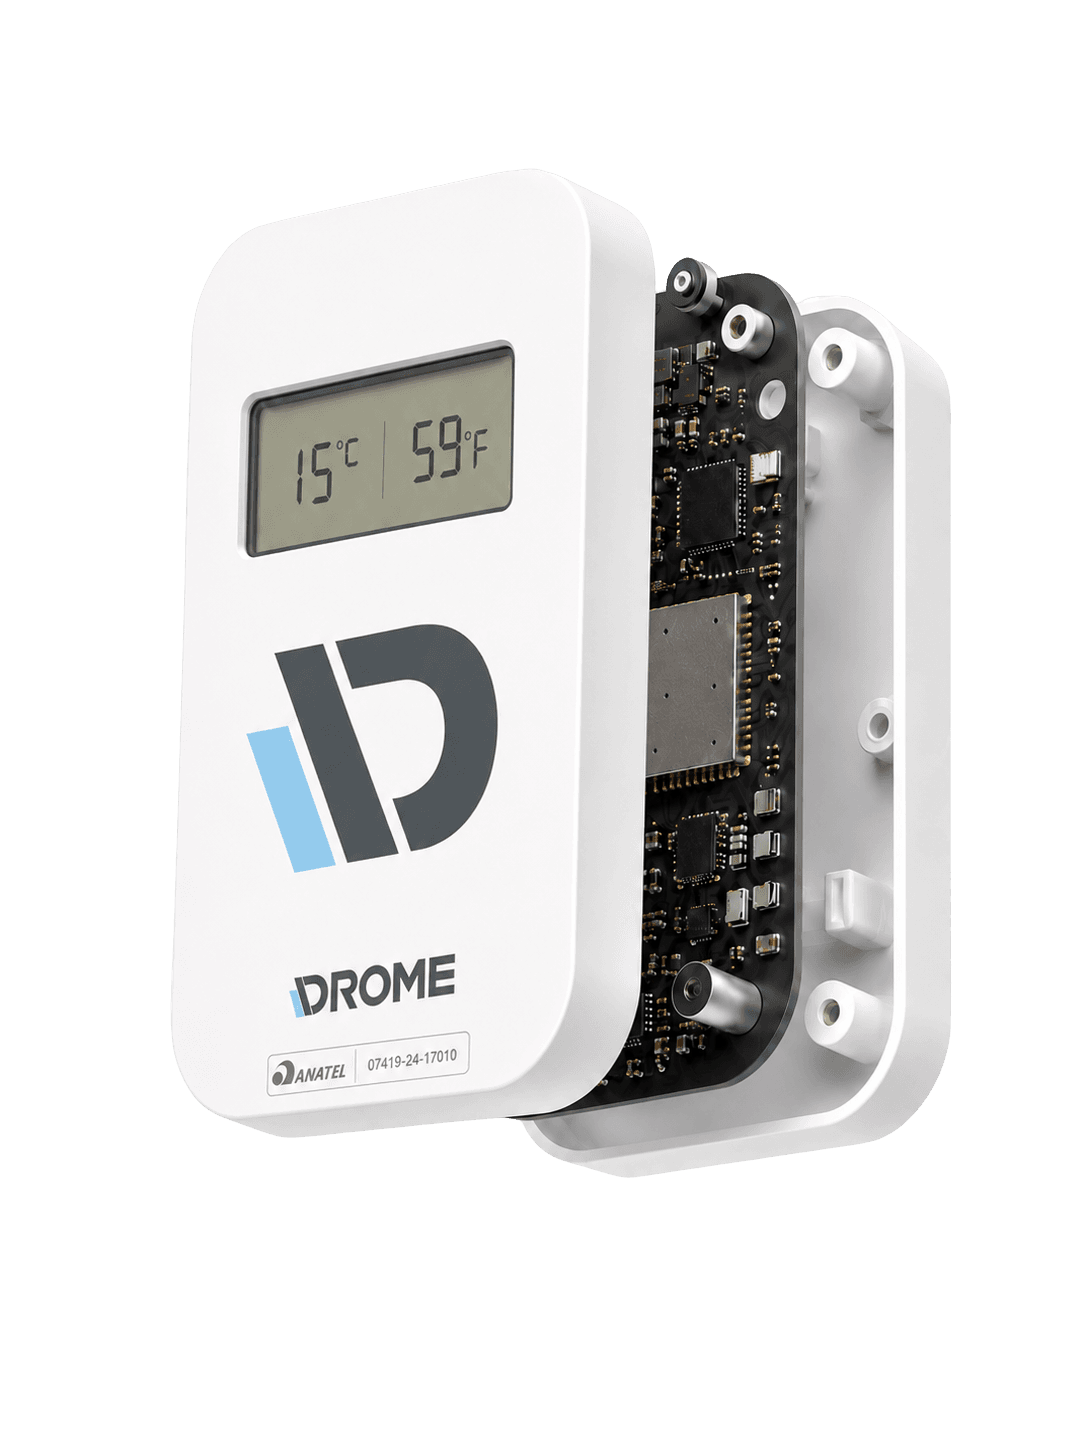
Internal sensing element.
Internal element.
Measures products, liquids, ducts and points the sensor body cannot reach.
Integrates third-party transmitters and converts the signal into digital data.
Reads pulses from compatible water meters.
Measures the angle relative to the ground and raises an alert when the structure goes out of plumb.
Counts people entering and leaving the space, without identifying individuals.
Measures line pressure and totalizes the consumption of medical and industrial gases.
Tracks the reservoir level and warns about shortage or overflow.
Totalizes operating hours and on/off cycles of electrical equipment.
| Communication | BLE 2.4 GHz for local setup, LoRa 915 MHz with proprietary protocol for transmission |
|---|---|
| Power | 2 alkaline AA batteries |
| Battery life | From 1 to 5 years, depending on the transmission interval: 1 year at a 1-minute interval, 5 years at 15 minutes |
| LoRa range | 165 to 985 ft (50 to 300 m) with obstacles, up to 1.2 mi (2 km) in open field |
| BLE range | 33 ft (10 m) with obstacles, 165 ft (50 m) without obstacles |
| Local memory | Circular buffer in non-volatile EEPROM, 6 days or 8,640 samples |
| Operating temperature | -40 to +140°F (-40 to +60°C) |
| Operating humidity | 0 to 99% RH |
| Protection | IP41 |
| Dimensions | 2.8 x 1.8 x 1.4 in (70 x 45 x 35 mm) |
| Weight | 6.7 oz (190 g) |
| Color | White, or black on request |
| Compatible probes | PT-100, DS18B20, pulse counter, Modbus RTU |
| Data usage | 60 MB per month |
| Certification | FCC |
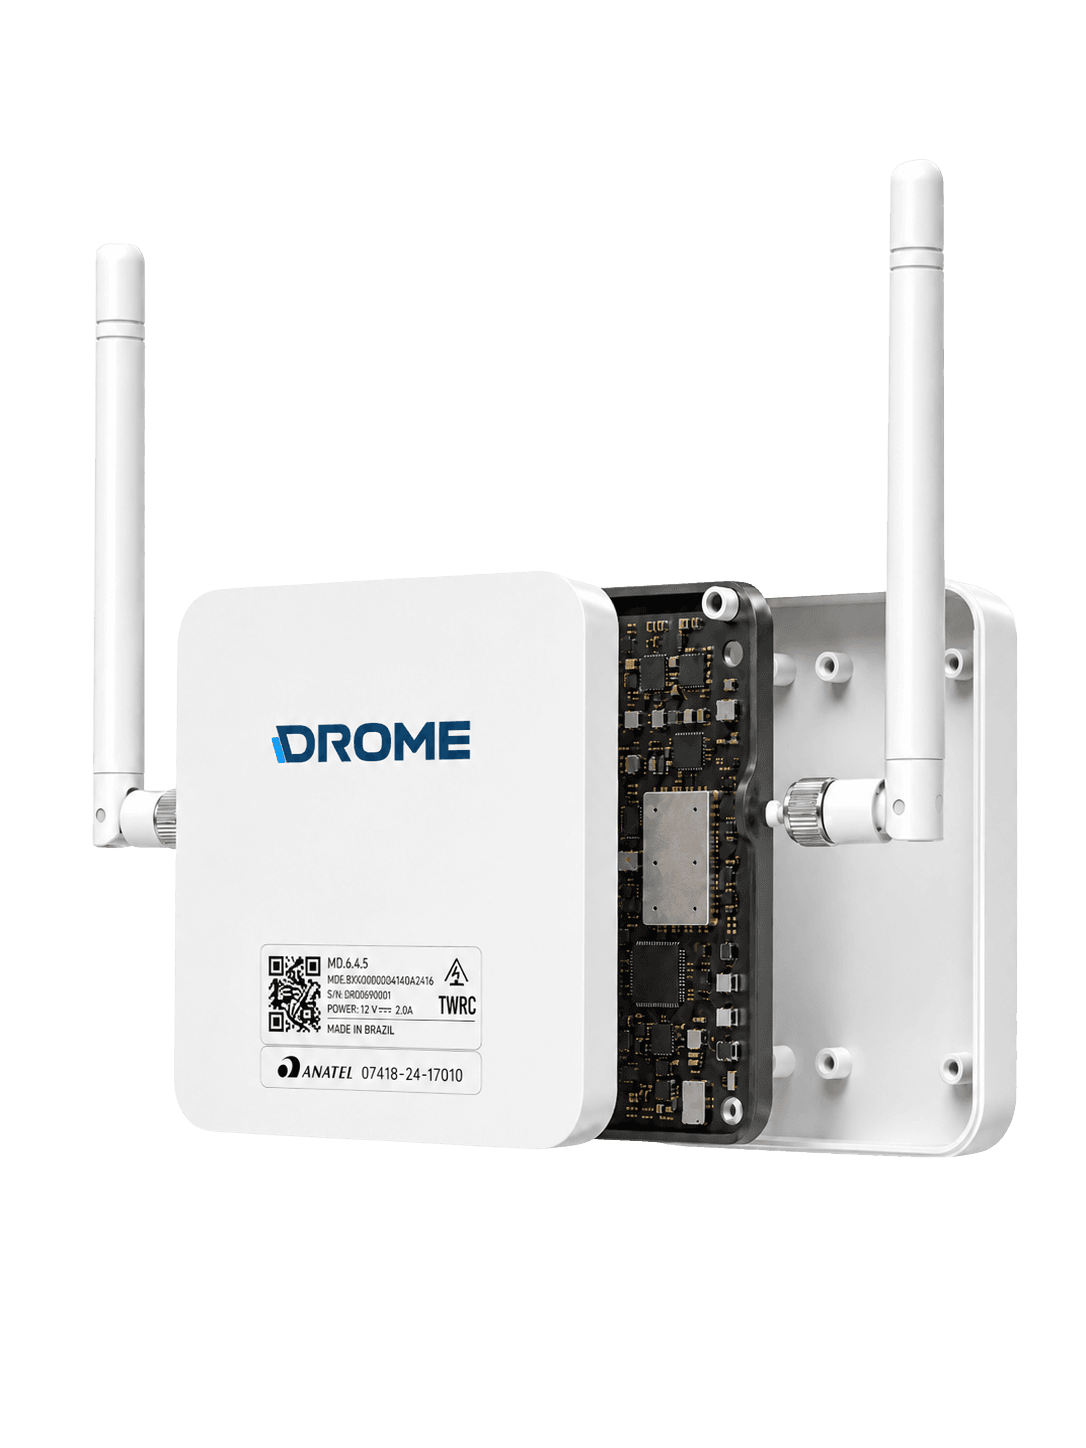
Gateway that integrates the sensors and equipment in a sector, collecting, storing and sending the data to the platform over encrypted MQTT. It keeps monitoring continuous even during a temporary network failure, thanks to the local buffer. It connects to the internet over Wi-Fi, Ethernet or cellular, receives the sensors over BLE and LoRa, and speaks Modbus to integrate with the automation already in the hospital.
Central point of each block or sector. Uploads the data over Wi-Fi or over 4G with a multi-carrier SIM that connects to the best available network.
NB-IoT connectivity for coverage in indoor and remote areas, with low power and low data cost.
Direct integration with PLCs, meters, industrial controllers, chillers and building automation.
For environments with restrictive Wi-Fi or a need for greater connection stability.
Powered by the OBD2 connector of the vehicle.
Powered by the 12V socket, for temporary use with no electrical work.
| Connectivity | Wi-Fi 2.4 GHz with WPA and WPA2 (802.11 b/g/n), wired Ethernet, multi-carrier 4G cellular, NB-IoT, BLE 2.4 GHz, LoRa 915 MHz |
|---|---|
| Protocols | Serial UART, Modbus RTU, Modbus TCP, I2C |
| Transmission | MQTT with encrypted data to the DROME cloud |
| Power | 110 to 220 VAC. Backup battery rated for 6, 12 or 24 hours of autonomy during a power outage. Vehicle version from 12 to 24 VDC |
| Local memory | Circular buffer in non-volatile EEPROM, up to 20 days or 28,800 samples |
| Operating temperature | 32 to +140°F (0 to +60°C) |
| Operating humidity | 0 to 99% RH |
| Protection | IP41 |
| Dimensions | 6.2 x 2.4 x 1.2 in (158 x 62 x 31 mm) |
| Integrated measurements | Ambient temperature, internal equipment temperature, humidity, CO₂, differential pressure, electrical quantities, electrical and water consumption, door openings, presence, Modbus equipment |
| Compatible sensors | The entire Satellite Sensor line |
| Certification | FCC |
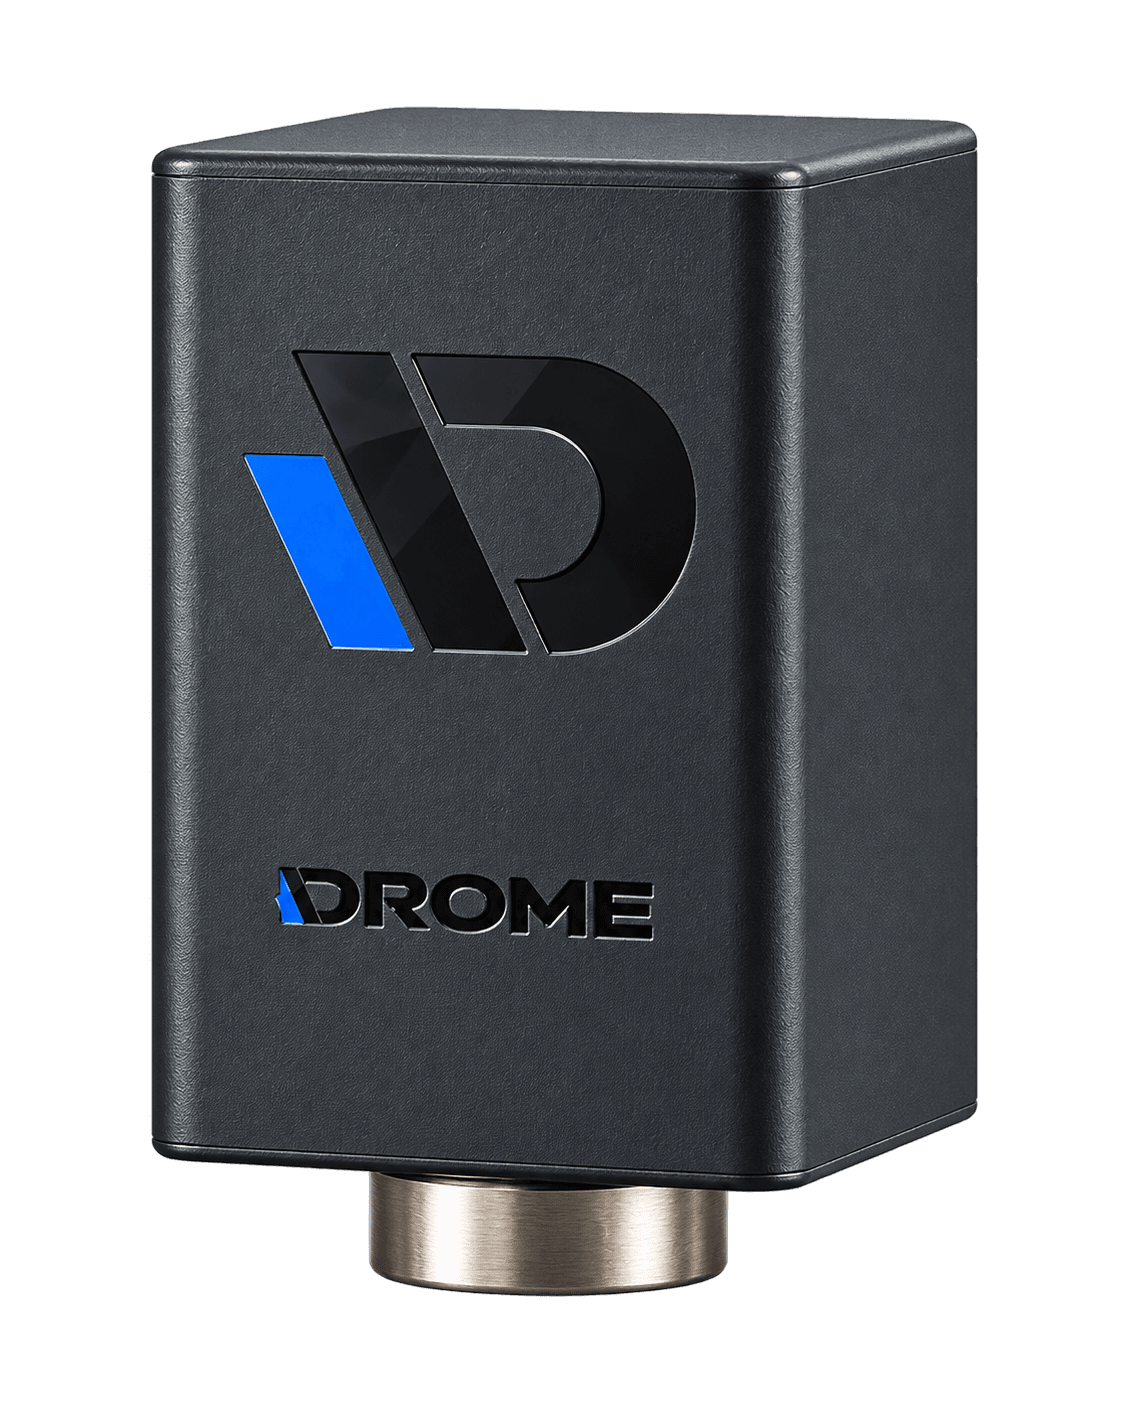
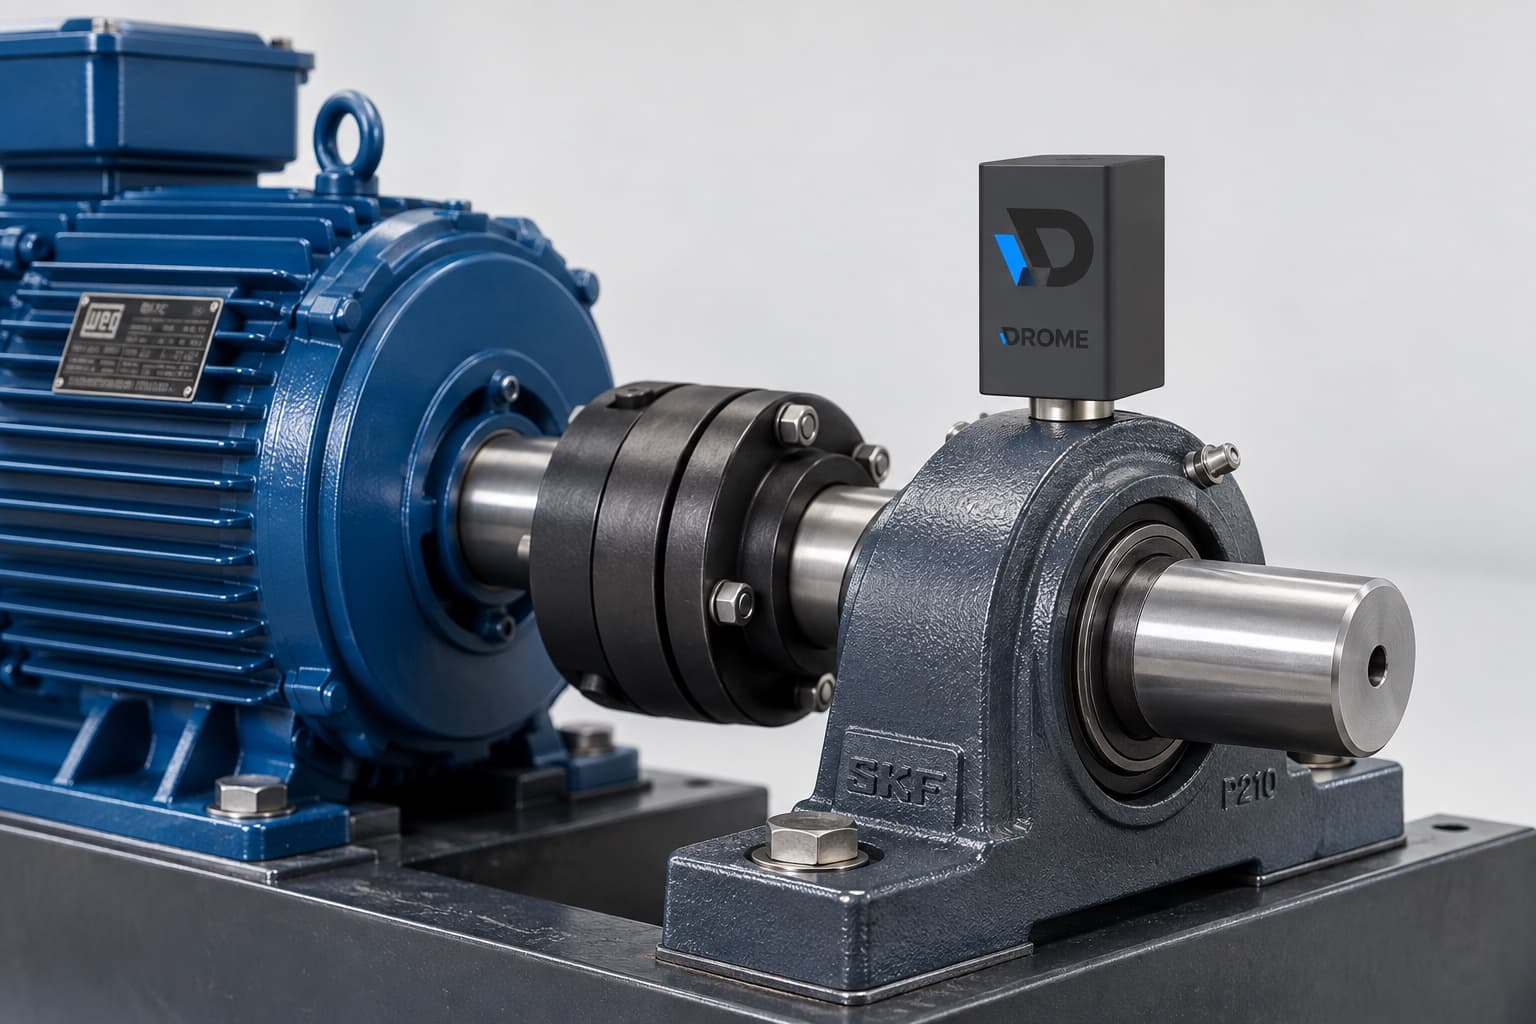
Triaxial accelerometer in a metal body, mounted straight onto the bearing or motor housing. It measures vibration on the X, Y and Z axes, computes the frequency spectrum and tracks the tilt of the point. Every 15 minutes it sends the RMS over LoRa, and four times a day it records a full waveform capture for spectral analysis. The goal is not to grade the machine, it is to warn you when the machine changes relative to itself.
Continuous duty and steady rotation, the scenario where the spectral signature is cleanest.
Fixed speed. With the blade count on record, blade pass shows up named in the spectrum.
Broadband rising with no dominant peak is usually cavitation.
Here what matters is tilt and impact, not the rotation spectrum.
| Sensing element | Triaxial accelerometer with FFT analysis, X, Y and Z axes |
|---|---|
| Vibration | RMS from 0 to 64.3 m/s², resolution of 0.001 m/s² |
| Frequency range | 3.1 to 1,596.9 Hz, resolution of 3.125 Hz |
| Tilt | 0 to 180°, resolution of 0.35° |
| Direction | 0 to 360°, resolution of 0.70° |
| Reported axis | The one with the highest RMS among X, Y and Z |
| Sampling rates | 50, 100, 200, 400, 800, 1,600 and 3,200 Hz, configurable per measurement point |
| Spectral capture | 2,048 samples per axis, window from 0.64 to 40.96 s depending on the rate |
| Cadence | RMS every 15 minutes over LoRa, plus 4 spectral captures a day |
| Communication | BLE 2.4 GHz for local setup, LoRa 915 MHz for transmission |
| Mounting | Threaded base, installed straight onto the bearing or motor housing |
Vibration becomes a product when the manager does not have to be a specialist to read it. DROME does not return a 0 to 100 score, it returns a state with a named cause and a deadline for action.
Four times a day the sensor records two captures, a fine one for resolution and a wide one for high-frequency content. In between, the RMS arrives every 15 minutes over LoRa and works as an event detector.
The raw waveform is uploaded whole and the spectrum is computed on demand, never stored. The data stays reprocessable as the criteria evolve, with no need to rebuild history.
Each point becomes its own reference, with a median and a robust deviation per frequency band. Gain error, mounting resonance and noise floor cancel out in the ratio, which is why DROME uses neither ISO zones nor a generic score.
Saturation, machine stopped, unstable regime and immature baseline are all checked before any index runs. A machine that is off does not become an alarm, it becomes a state. And the alarm only fires after confirmation across consecutive captures.
| Signature | Probable cause | What the team reads on screen |
|---|---|---|
| 1× rotation | Unbalance | The machine rotation is stronger than normal. It is usually built-up dirt, a bent blade or a missing part. |
| 2× rotation | Misalignment | A knock appeared every half turn. It is usually misalignment between motor and machine, or a worn coupling. |
| 1× with harmonics | Mechanical looseness | Knocks repeating several times per turn. It is usually a loose base, a slack bolt or a worn bearing housing. |
| 0.5× or subsynchronous | Rubbing or bearing clearance | A vibration slower than the rotation appeared. It is usually a part rubbing or a bearing with clearance. |
| Blade count × rotation | Blade pass | Blade pass is stronger. It is usually an obstruction, dirt on the rotor or a damaged blade. |
| Broadband, no peak | Cavitation, turbulence or friction | Overall noise rose with no dominant frequency. On a pump it is usually cavitation, otherwise friction. |
| 120 Hz | Electrical problem | Vibration appeared at the power line frequency. It is usually a motor problem, not a mechanical one. |
Without the machine rotation on record, the platform states the limitation instead of guessing a cause: it reports that the point changed relative to its own normal and stops there. Equipment with variable frequency drives, gearboxes, reciprocating compressors and many-bladed fans is out of range in this version. The warning horizon is weeks to days, not months.
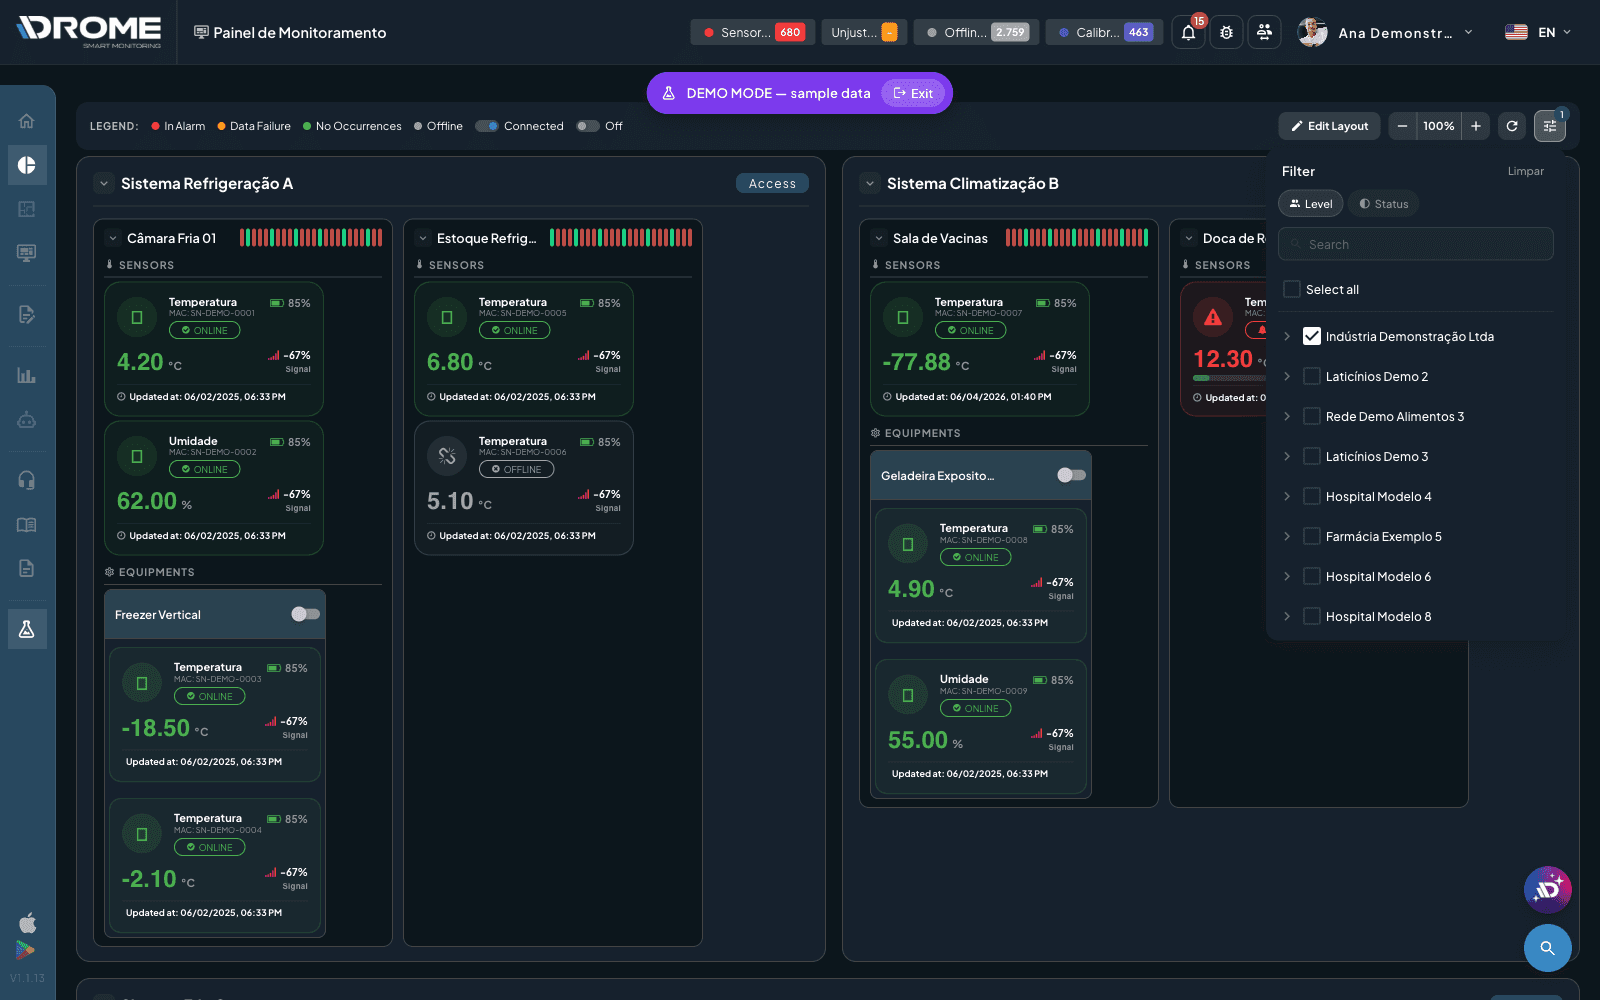
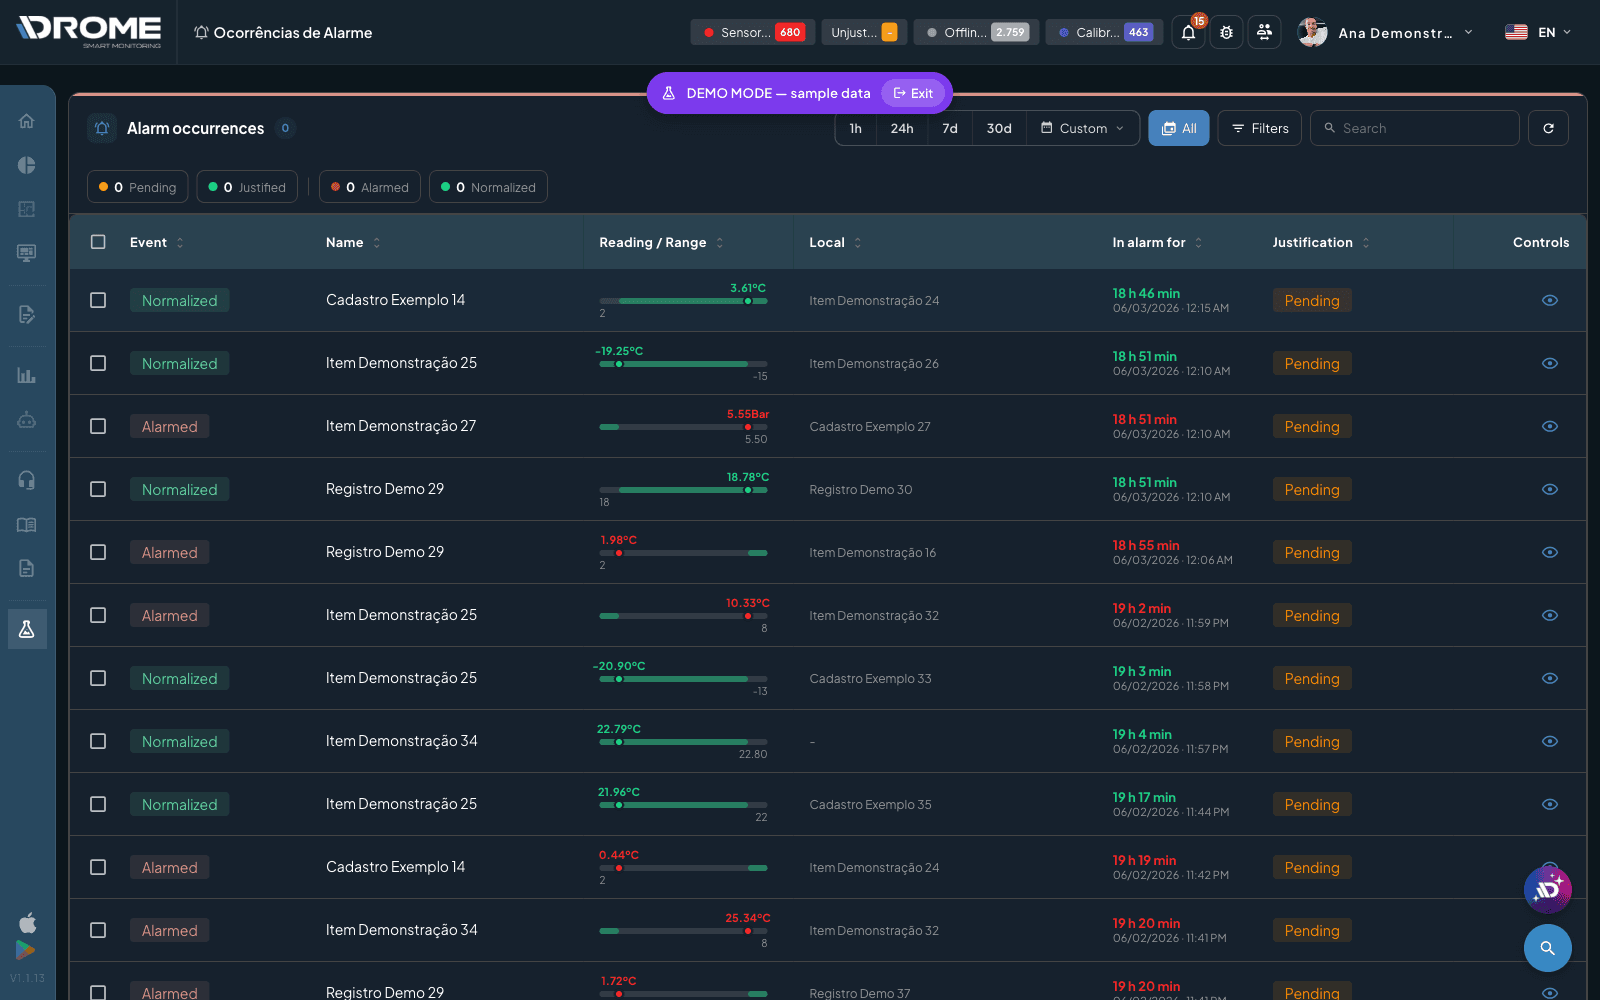
The hardware measures and sends. It is in the DROME platform that data becomes insight, alarms and reports. See three real screens of the system.
The panel brings systems, units, equipment and sensors together in a hierarchical tree that updates in real time. Each point status shows by color and the detail is a few clicks away.
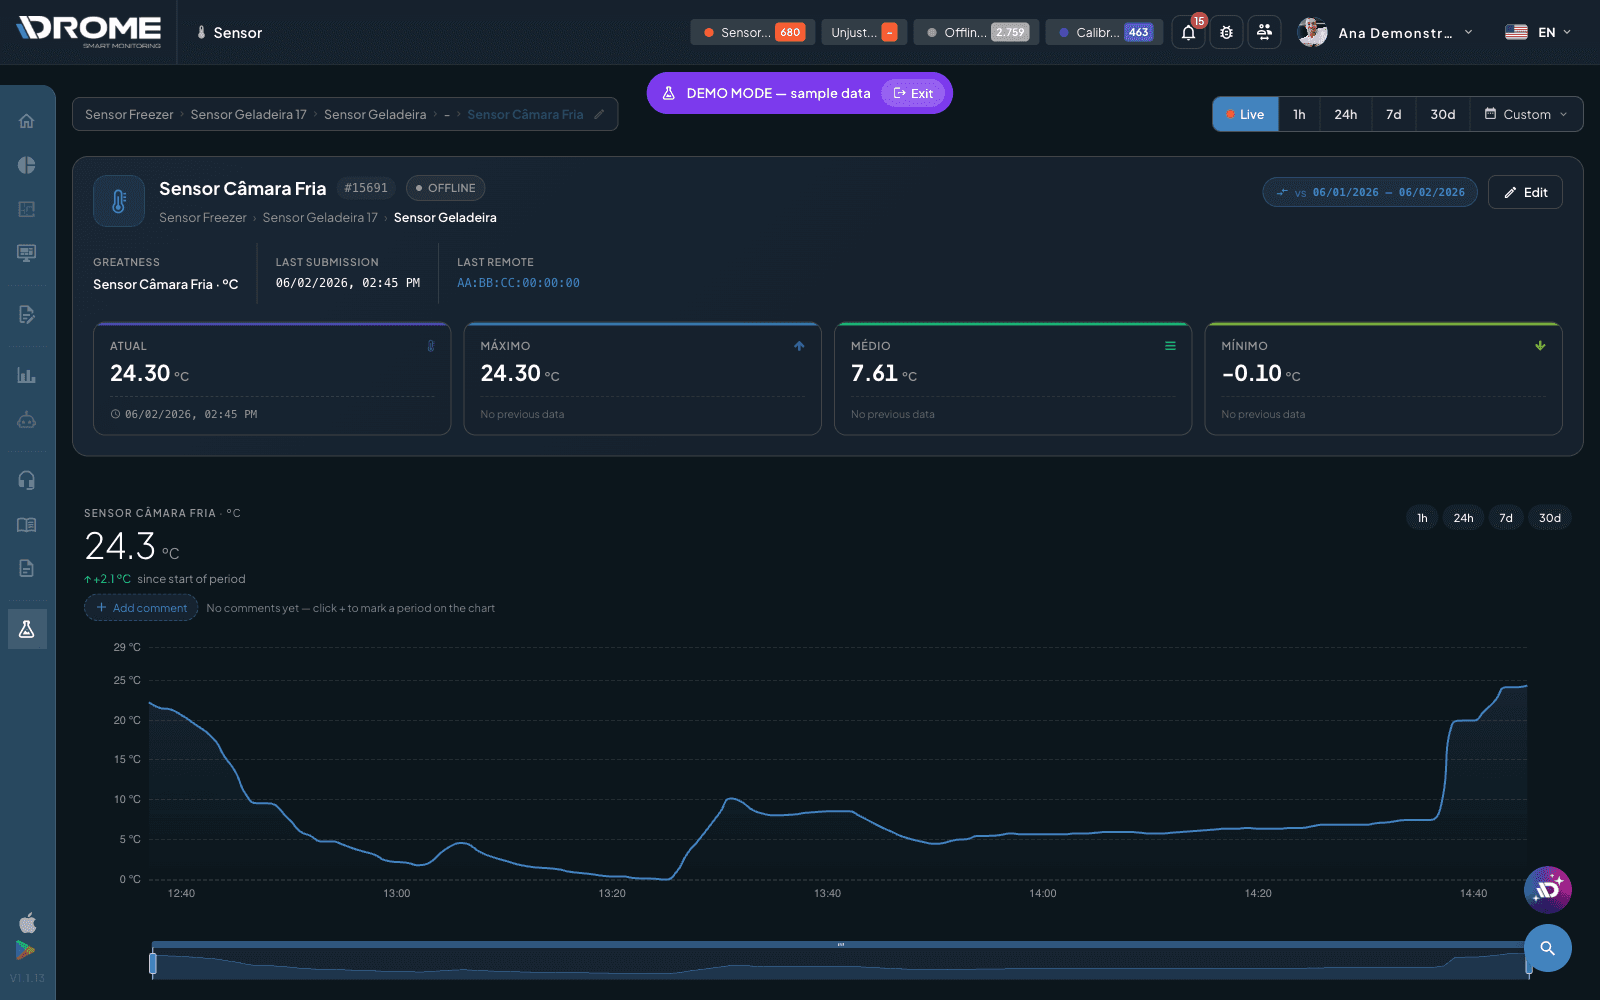
The sensor screen shows the current reading, the history and the alarm bands on the same chart. You can compare periods, comment points on the curve and export everything for audit.
Every alarm occurrence is logged with reading, range, duration and justification, alongside the audit trail and calibration control. All exportable to Excel and PDF.
Select what you need to monitor and see which DROME device solves it.
We show the devices and the platform live, with data from an environment similar to yours.