
Facing the daily challenges of the cold chain, I've consistently heard the same concern from managers: "How can we avoid waste and meet demand without risking stockouts or overstock?" This question is more common than it seems, and from what I've observed, it arises primarily because tracking seasonal trends and forecasting demand goes far beyond spreadsheets and intuition.
Throughout this article, I share my experience and best practices for transforming uncertain forecasts into operational security – showing how technology, especially initiatives like DROME, makes all the difference in this process.
Why do seasonal trends weigh so heavily on the cold chain?
In my consultations, it became clear that pharmaceuticals, vaccines, and food products experience significant consumption variation due to climate, public health campaigns, holidays, school breaks, and even unforeseen events like disease outbreaks. If you've ever had to double vaccine stocks in the middle of winter, you know exactly what I'm talking about.
Understanding seasonal trends is the first step to forecasting demand with precision.
- April and May bring high demand for flu vaccines.
- Summer requires increased stock of beverages, ice cream, and dairy products.
- Holiday dates radically change order profiles.
- Equipment maintenance windows coincide with low demand in certain periods.
Without monitoring these movements, losses become the rule, not the exception. But observing trends is only the beginning of the story.
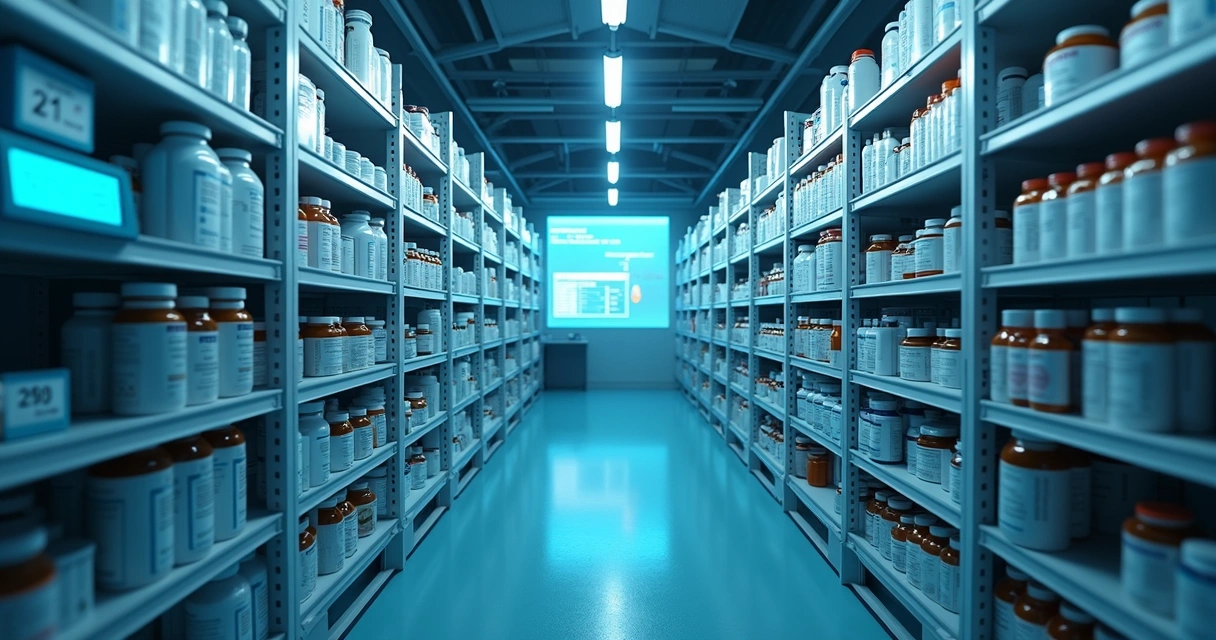
How I map seasonality
I start by mapping detailed consumption histories. I pull at least three years of records – the more, the better. I pay attention to:
- Daily sales and withdrawal volumes;
- Loss records due to expiration or damage;
- Climate variations during peak periods;
- Changes related to external campaigns or industry developments.
I've noticed that even with data, errors occur when information remains fragmented across multiple departments. That's why centralizing data on a robust SaaS platform like DROME makes all the difference. It integrates real-time information, connects IoT sensors, and generates detailed reports.
Centralized data changes everything.
Only then could I obtain real patterns, compare different years, and build reliable graphs.
Identifying patterns and anticipating behaviors
In the process, I learned that patterns aren't always obvious. What seems unpredictable often follows clear rhythms when viewed in the right grouping.
Predictive analytics tools can identify even minimal variations, such as consumption spikes anticipated by climate changes or major event openings.
To anticipate behavior, I typically:
- Adjust report filters to detect weeks with higher losses.
- Cross-reference inventory data against external campaigns and weather.
- Examine automated alerts created by intelligent systems.
DROME, for example, combines environmental sensors and artificial intelligence algorithms to detect anomalies in consumption patterns and suggest adjustments before problems occur. This reduces waste and the risk of supply loss – an advantage I haven't seen in competing solutions.
The importance of continuous monitoring
If anything changed how I work, it was realizing the impact of real-time monitoring. Before, I only discovered failures or demand fluctuations when the loss was already real.
Continuously monitoring environmental variables prevents silent losses and anticipates unexpected demand.
For example: sensors installed inside cold rooms can almost instantly alert about temperature drops or unusual increases in door-opening frequency, signaling possible demand surges.
While some competitors deliver basic monitoring systems, DROME goes further and enables sensor calibration management, making data reliable for audits. This extra layer of reliability makes all the difference, especially in sectors dependent on strict certifications.
When predictive analytics changes the game
In my consulting work for healthcare and food logistics organizations, I've seen many managers still hesitant to trust predictive analytics – mainly because they only know expensive or ineffective solutions. With DROME, it's clear that forecasting trends isn't just for large multinationals.
With data from multiple variables and algorithms trained on your own historical records, we can create dynamic projections. This means:
- Detecting high-demand periods in advance to plan purchases and inventory.
- Alerting teams before any relevant consumption deviation.
- Guiding preventive actions to minimize the impact of abrupt fluctuations.
You can check how predictive analytics can prevent supply loss in another article on our blog.
How to use technology to your advantage
In my experience, migrating from manual to automated processes makes analyses faster and more reliable. I use systems that combine:
- Intuitive dashboards for inventory tracking;
- Automatic reports of weekly and monthly trends;
- Predictive alerts based on artificial intelligence;
- Sensor calibration management to ensure accuracy;
- Remote access, including mobile, for agile responses.
In companies where I've implemented DROME, detailed reports facilitate audits and quick decisions during critical moments. Additionally, IoT integration strengthens the database for future decision-making.
If you want to dive deeper into innovative technologies transforming Brazil, I recommend reading about how Logistics 4.0 transforms the cold chain.
Applying metrics to measure results
I wouldn't employ my strategies without clear metrics. With well-defined indicators, it's easy to see the difference between the old and new model.
Among the metrics I always track, I highlight: loss rate, inventory accuracy, average storage time, alert response time, and sensor reliability.
These and other suggestions can be found in 5 metrics to evaluate cold chain performance.
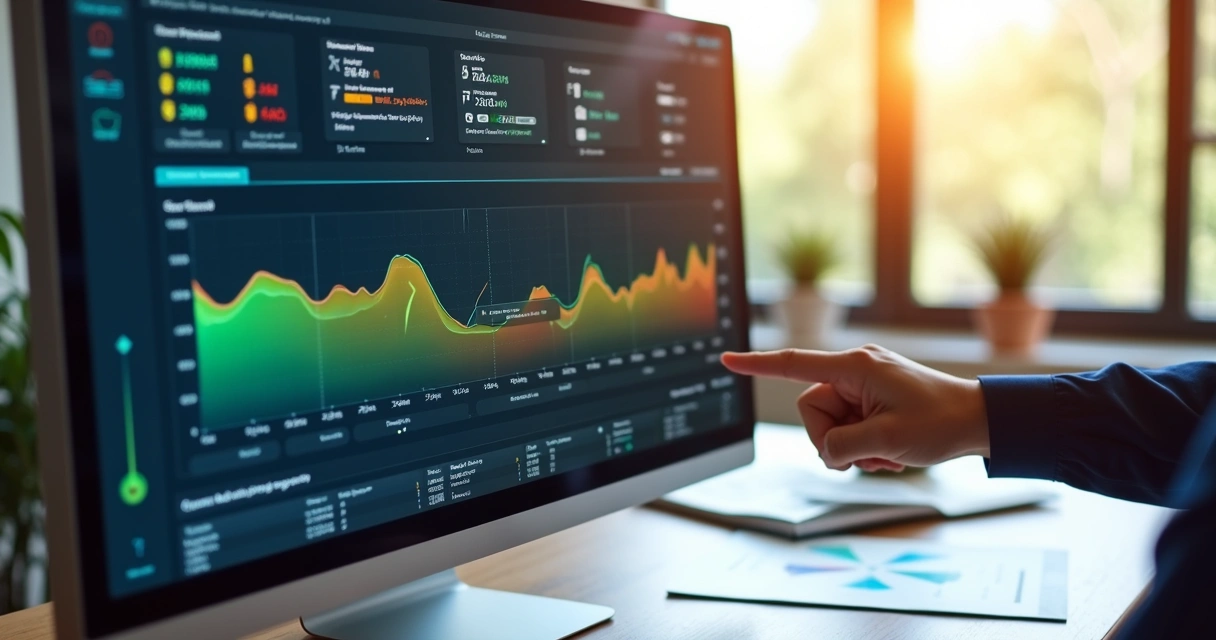
How to forecast demand with greater accuracy?
Beyond monitoring and mapping history, I dedicate time to constantly updating the algorithms used, basing them on industry information. With the DROME platform, I see that automatic adjustments to forecasting models make projections increasingly reliable, even facing unexpected fluctuations.
Another tip: consider integrating external data, such as weather forecasts, national vaccination campaigns, news, and industry trends. This helps calibrate your outlook for the future and prevents unpleasant surprises.
For a deeper look at technology's impact on monitoring and data analysis, it's worth checking how information technology transforms the sector.
What sets DROME apart?
After studying different platforms, I realized few offer real integration between multiple variables, accessible predictive analytics, and audit-ready reports. While some competitors focus only on temperature alarms, DROME's solution unites monitoring, artificial intelligence, prediction, and sensor calibration management in a single ecosystem.
DROME anticipates, alerts, and guides your cold chain decisions.
No other platform delivers, at the same time, total automation, simplified dashboards, and dedicated support for audits and compliance.
If questions still arise about the technological difference, I recommend exploring how AI can predict cold room failures and why this makes such a difference in preventing losses.
Conclusion: it's time to act
Comparing experiences across various sectors, I see that getting demand forecasts and seasonal trends right transforms the business. And this doesn't need to be complicated with the right technology by your side.
If you want to end waste, avoid surprises, and elevate your company's standards, I invite you to learn more about DROME. Our solution was built for those who demand security and precision at every step of the cold chain.
Take the next step and discover how forecasting can be simple and effective.
Read next

Humidity Control in Cold Chain: Ensuring Product Quality
Understand the importance of humidity control in cold chain operations to guarantee product quality and safety.

Industrial Gas Leaks: Predictive Detection & Risk Mitigation
Learn how sensors and predictive analytics detect industrial gas leaks, preventing accidents and ensuring operational safety.

RDC 275: Essential Standards for Food Safety
RDC 275 is essential for standardizing sanitary inspections and ensuring safety in the food sector.